In this study we investigate the performance of Bitcoin over varying times of the year.
Data
Date: April 28, 2013 to Aug 23rd, 2021
Timeframe: Daily
Source: coinmarketcap
Method
Isolated each period then computed the cumulative returns if a trader only held Bitcoin during that time.
Results
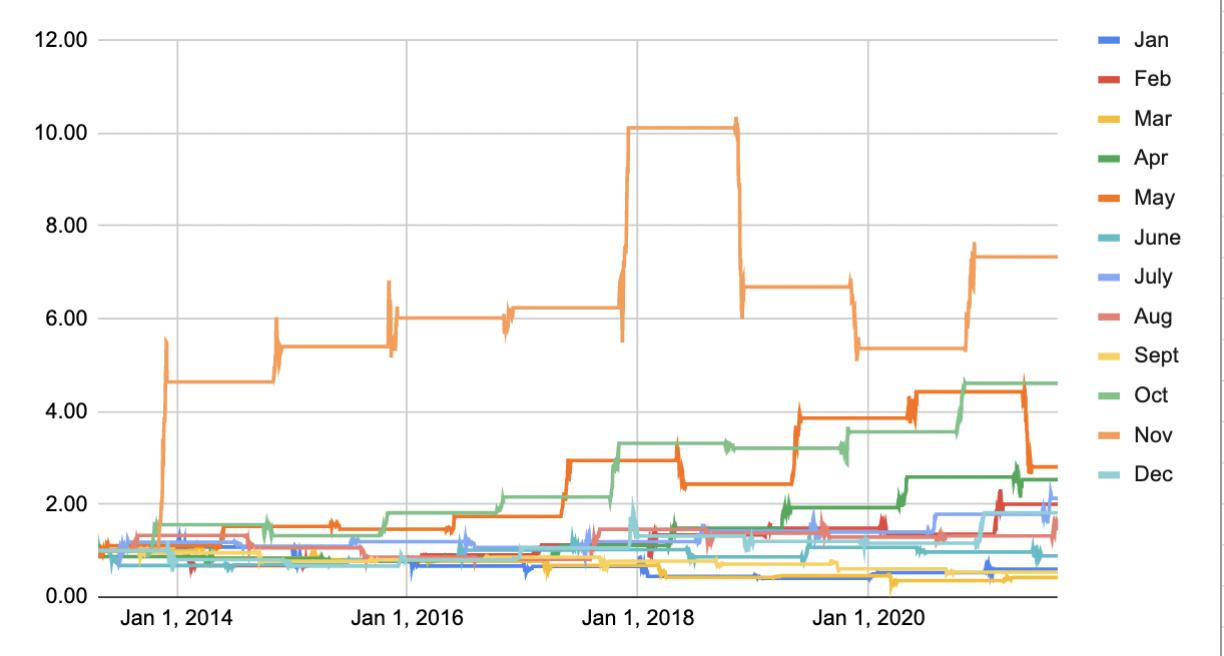
By Month
|
Month |
Cumulative Return |
|
Jan |
-39.80% |
|
Feb |
100.15% |
|
Mar |
-57.79% |
|
Apr |
153.12% |
|
May |
180.57% |
|
June |
-11.08% |
|
July |
112.77% |
|
Aug |
62.45% |
|
Sept |
-46.06% |
|
Oct |
360.62% |
|
Nov |
633.18% |
|
Dec |
81.72% |

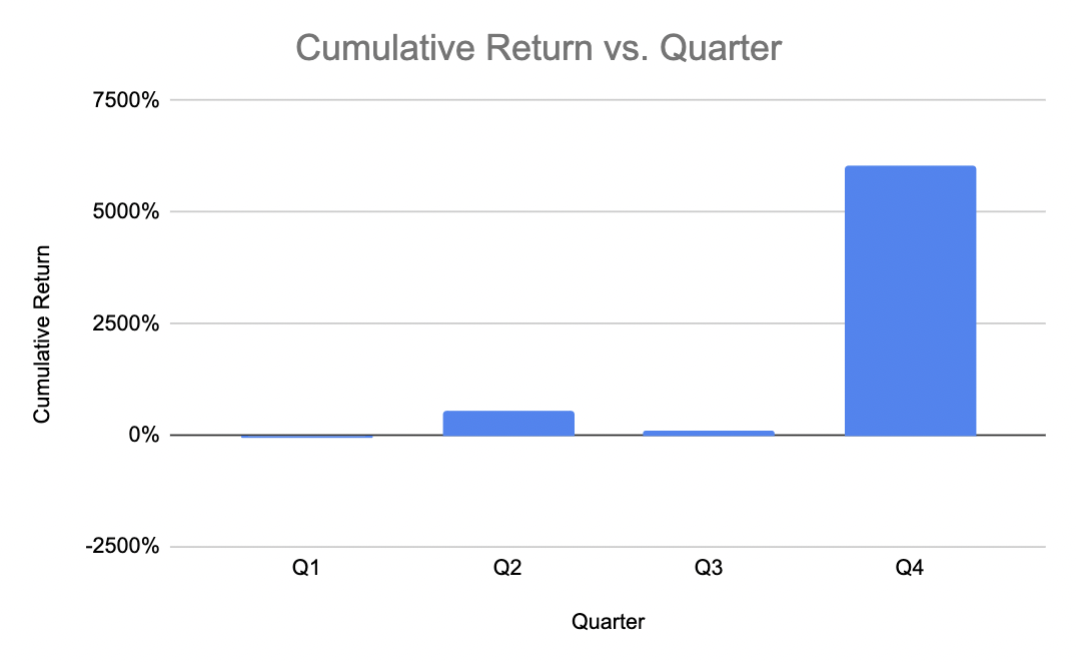
By Quarter
|
Quarter |
Cumulative Return |
|
Q1 |
-49% |
|
Q2 |
531% |
|
Q3 |
86% |
|
Q4 |
6037% |